Home & Living Zone

Kitchenware Zone

Office & School Zone

Kids Zone

Corporate Gifts Zone

Interials Zone

Compostable & Fiberware Zone

Copper Zone

Ethnic & Traditional Wear

Bags & Baskets Zone

Home Decor Zone

Furniture Zone

Coconut Shell Zone

Premium Zone

Economic Zone


-
 -2% OFF
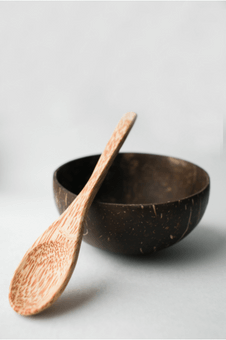
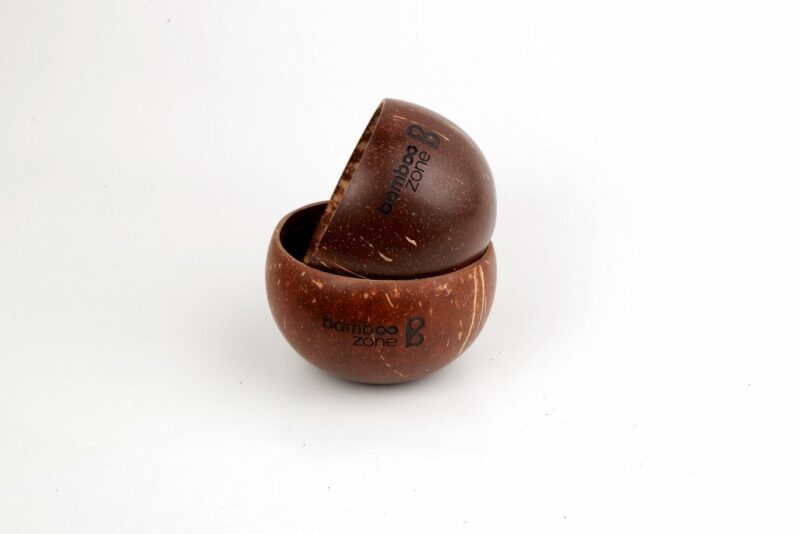
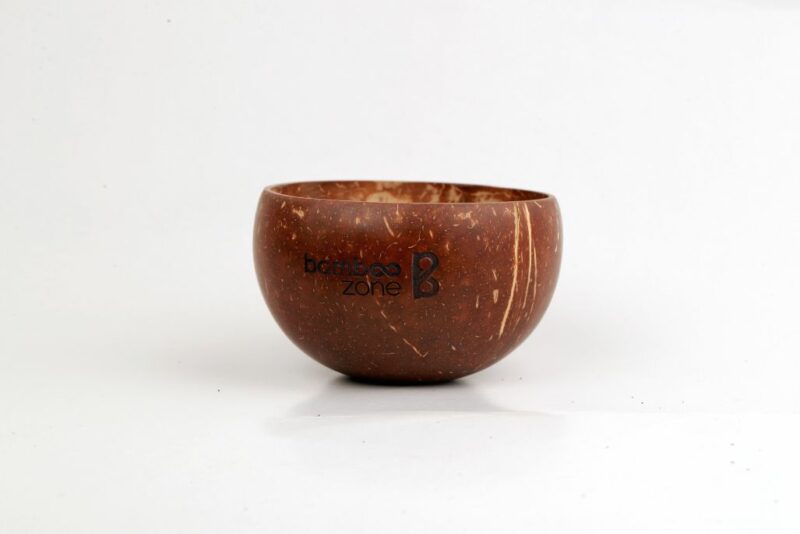
Coconut Shell Bowls
-
-2% OFF
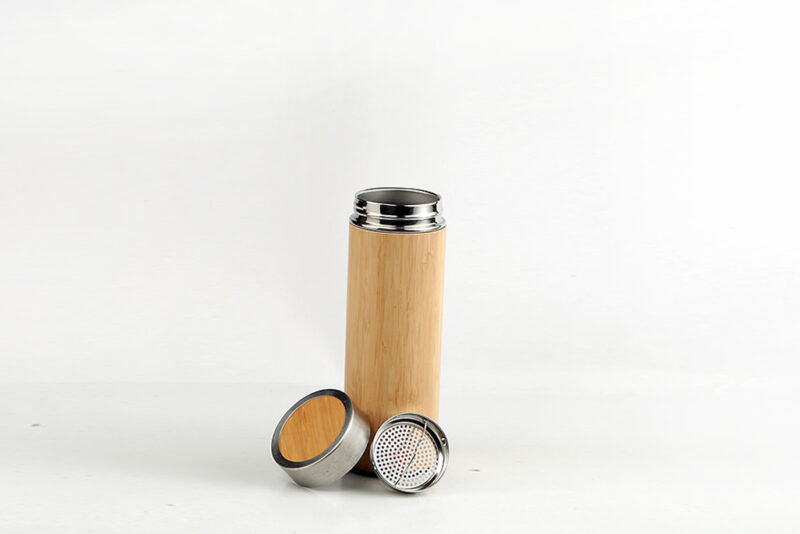
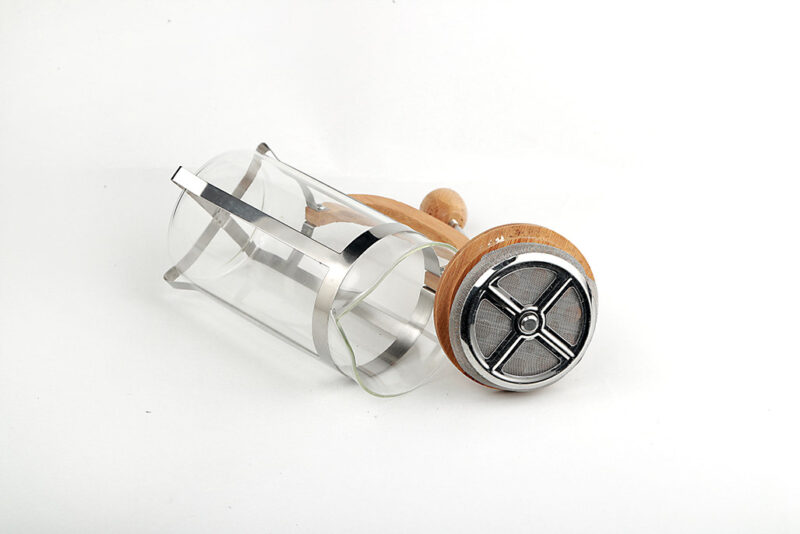
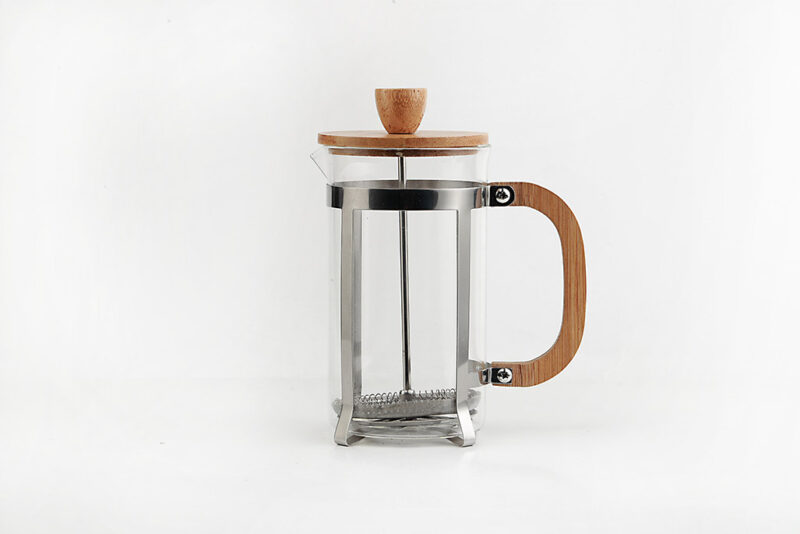
Bamboo Coffee Press (600ml)
-
-12% OFF
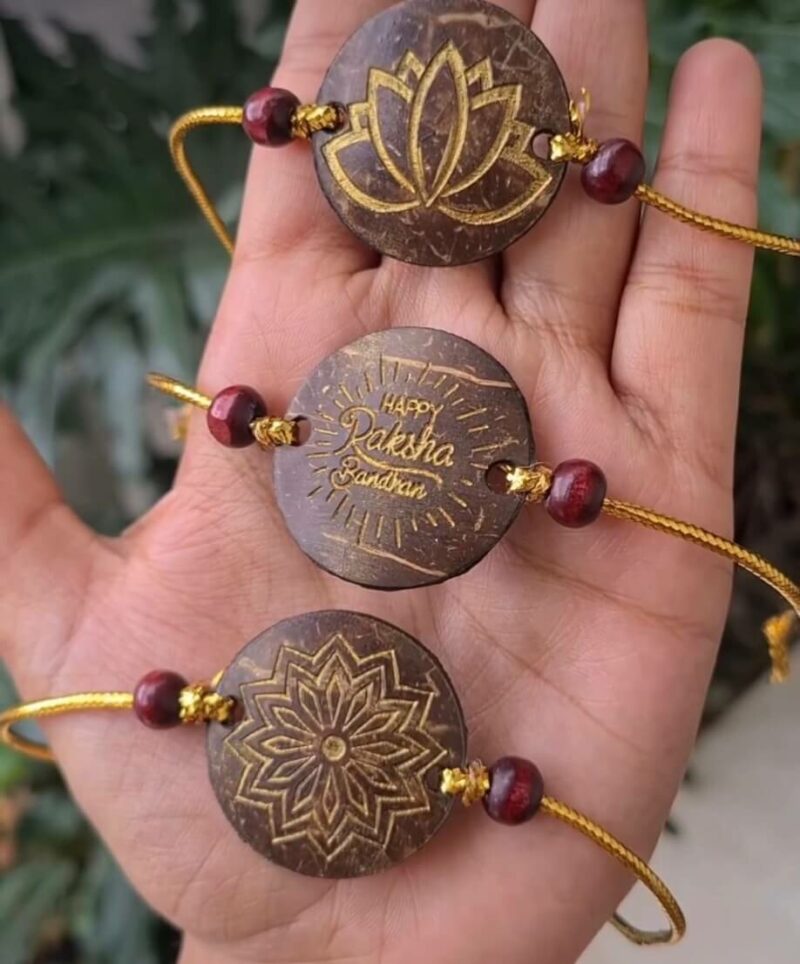
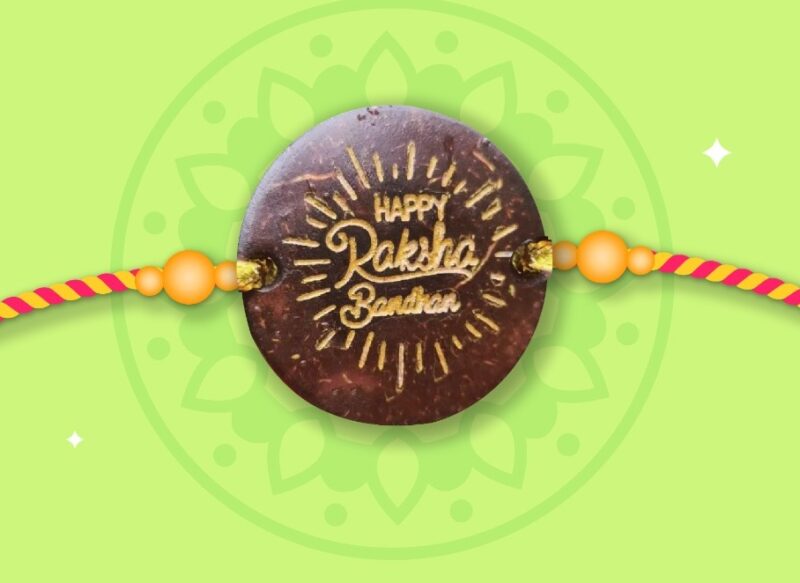
Coconut Shell Rakhi

-
-10% OFF
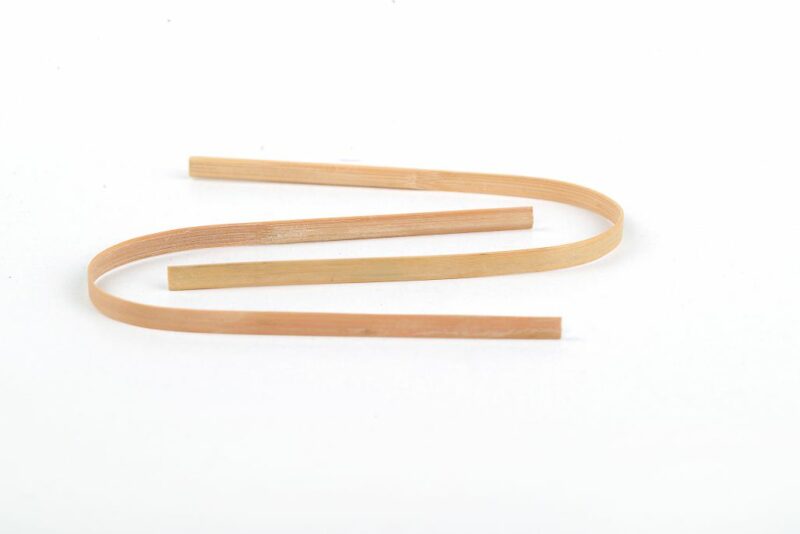
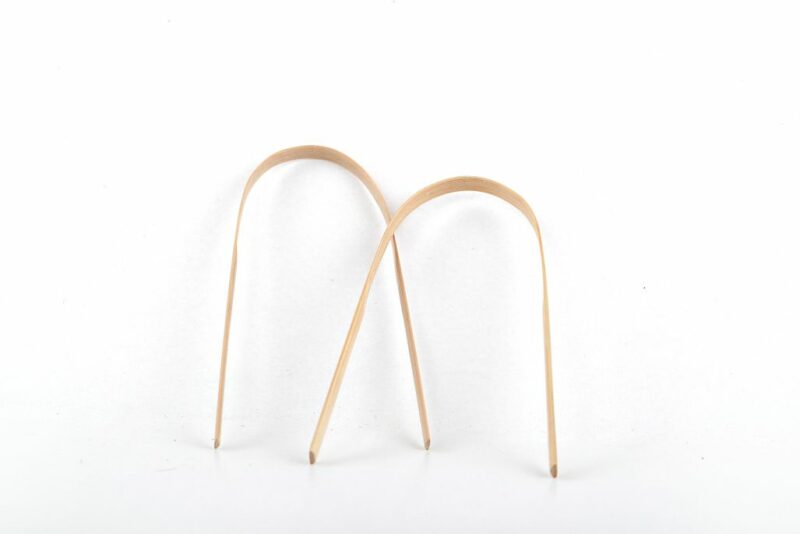
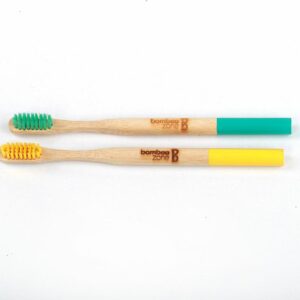
Bamboo Tongue Cleaner
-
-7% OFF
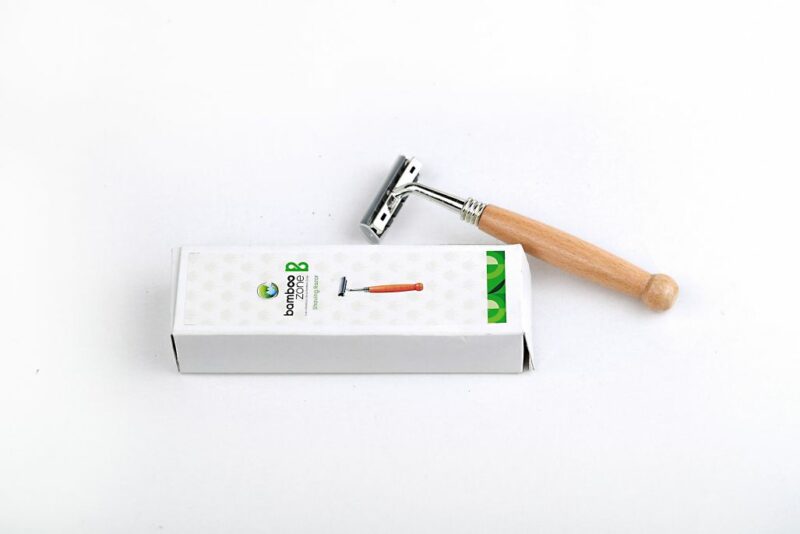
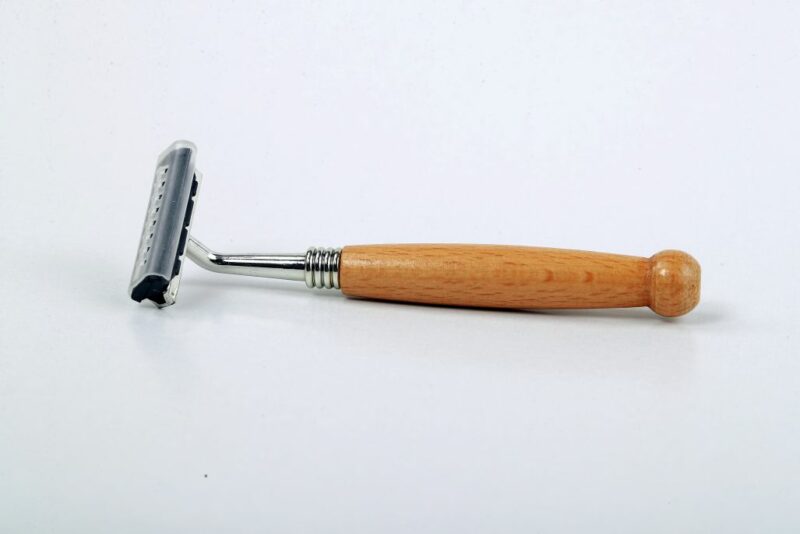
Bamboo Shaving Razor
-
-15% OFF
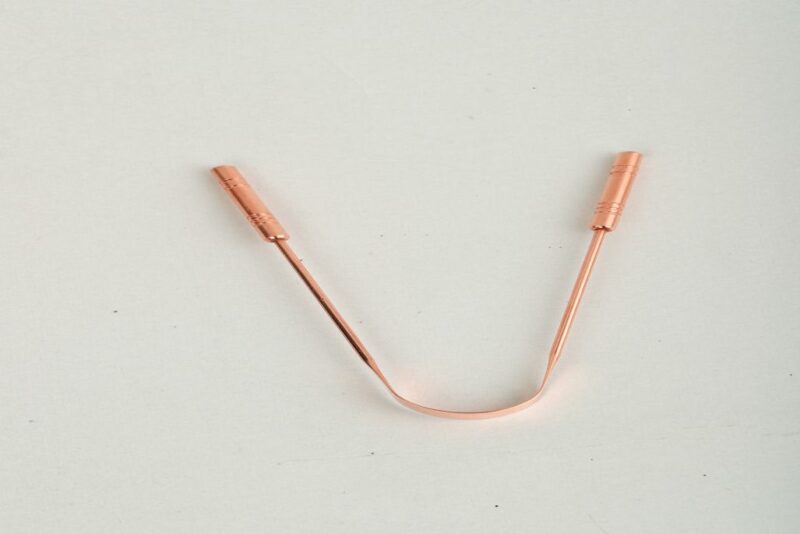
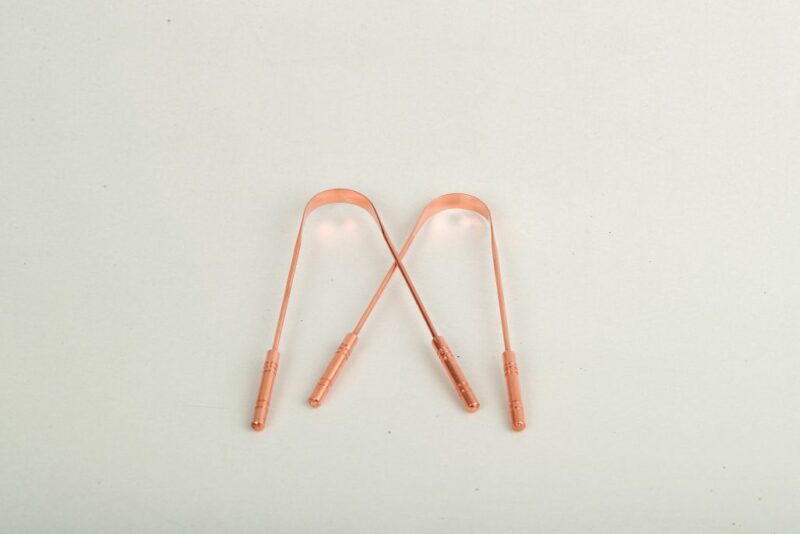
Copper Tongue Cleaner
-
-9% OFF
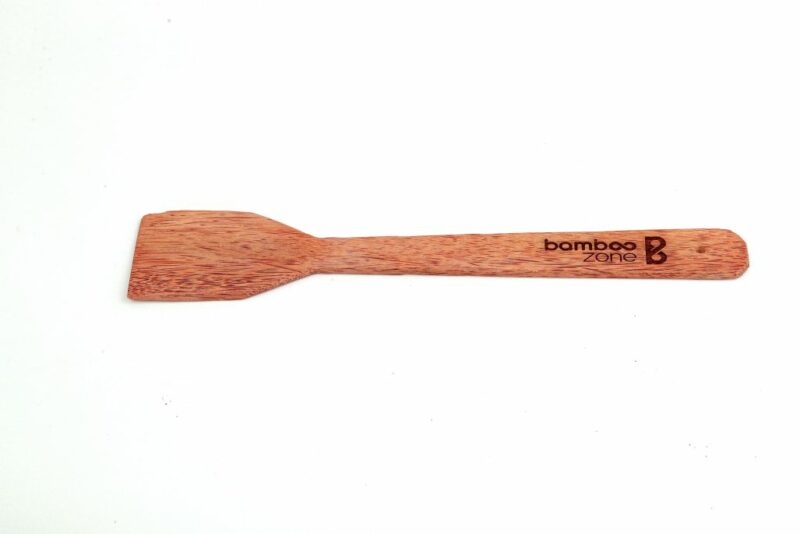
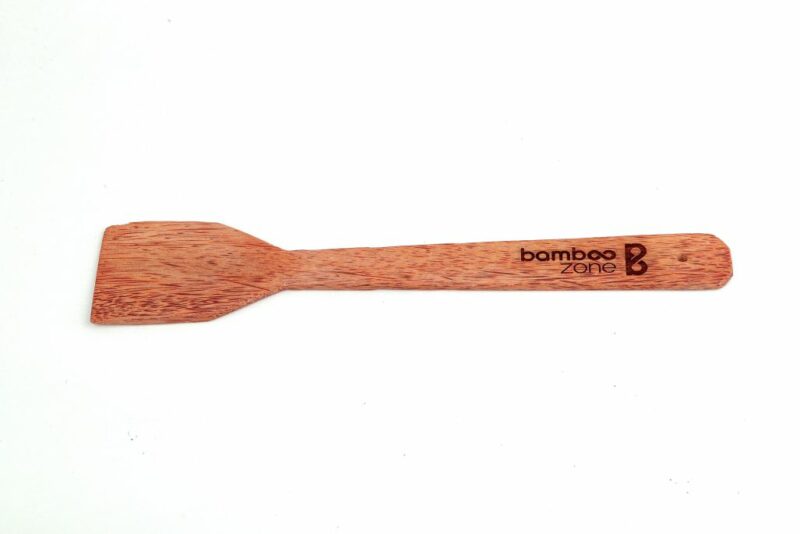
Coconut Wood Spatula
-
-9% OFF
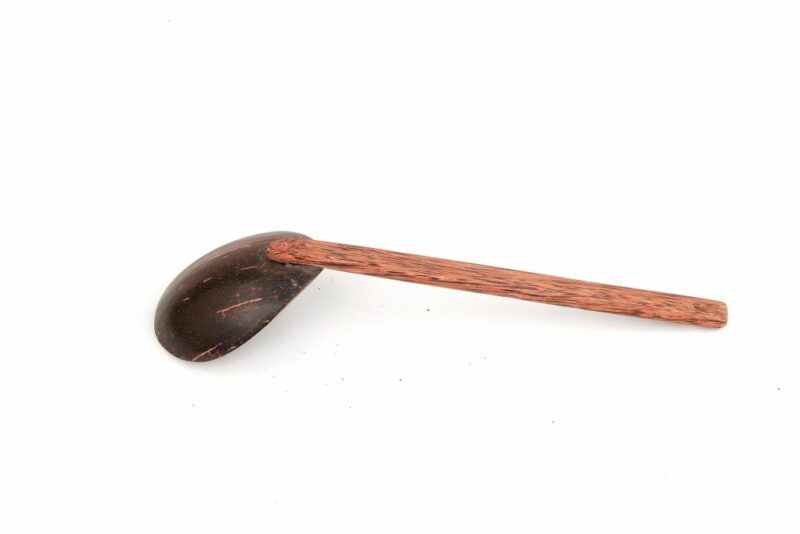
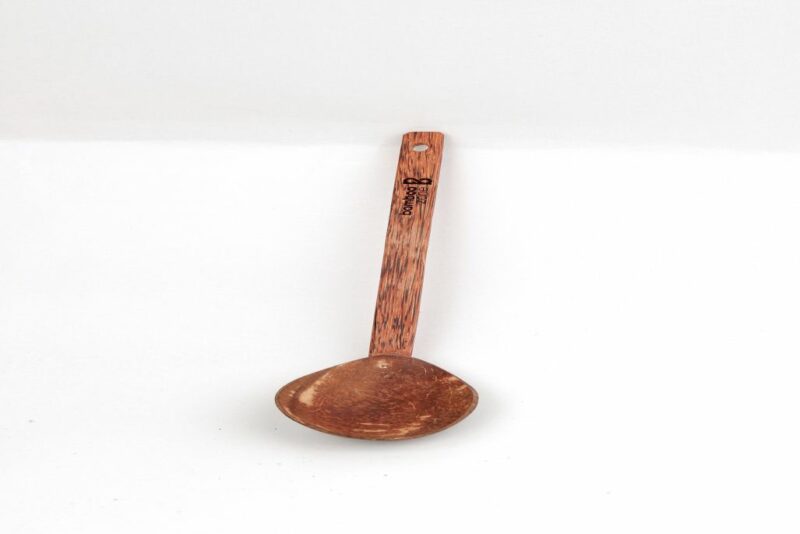
Coconut Shell Spoon (Thavi)
-
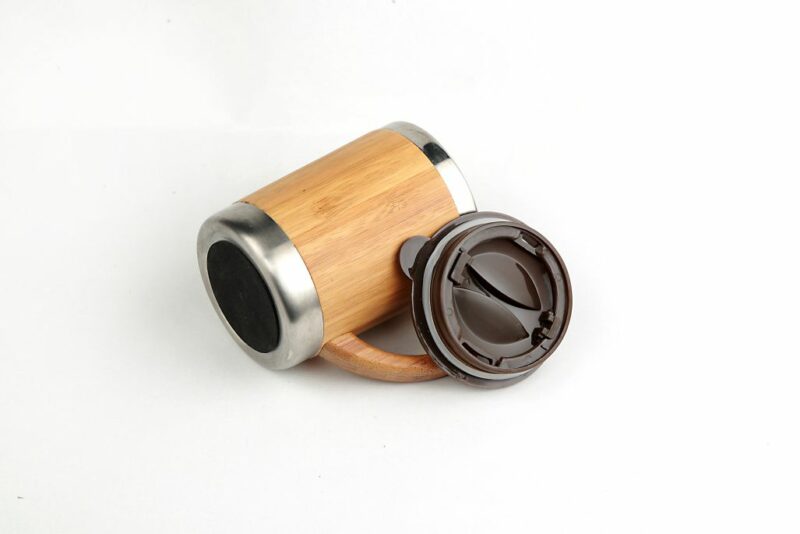
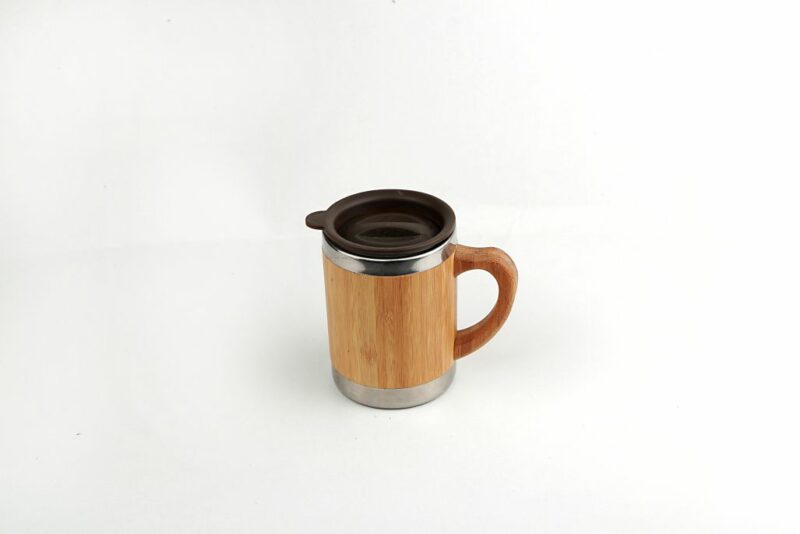
-4% OFF
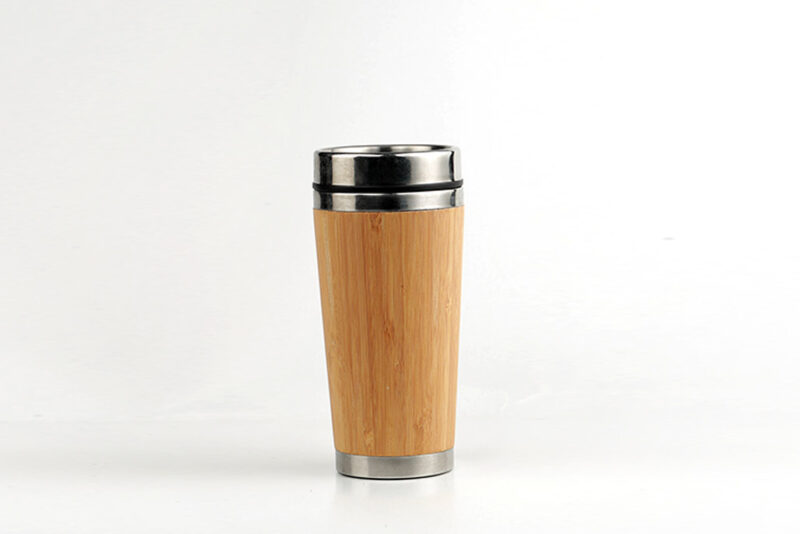
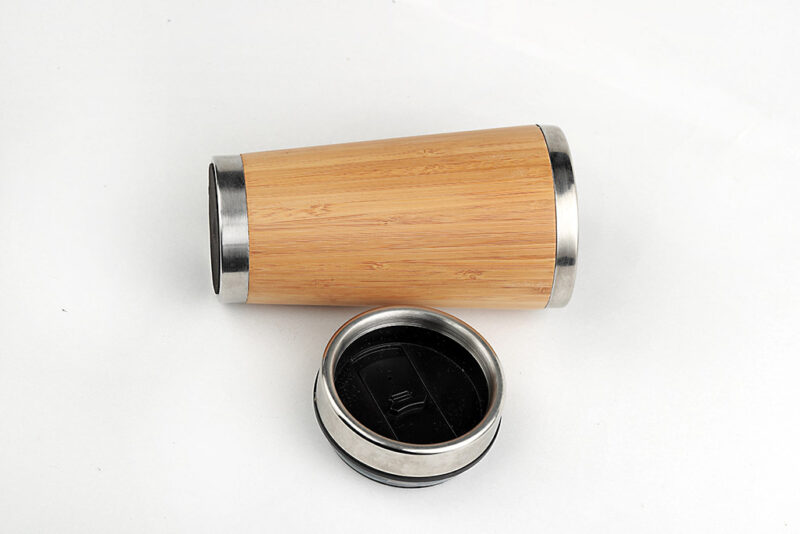
Bamboo Coffee Cup (330ml)